Wetter Weather Ahead
In our last blog, we talked how broad low pressure was forecast to develop over the western US. The details on this are starting to take shape. I'll probably provide an update on this during the middle of the week, but here's where things stand now.
First, we'll have a few dry and warmer days after our cold front on Saturday night. High pressure will build into the area Monday through Wednesday. Temperatures will be in the mid to upper 60s on Tuesday and Wednesday, with a little cooling on Thursday.

But it won't last. The low pressure in the above graph that is off the California coast will merge with the small low off the west coast of Canada. This will create a broad area of low pressure over the western US by the end of the week.

This weather pattern will bring us a cool and wet Thursday night and Friday. The rain could reach our area by Thursday afternoon, but the best odds are for Thursday night, with showers on Friday. That said, if the timing slows down, Friday could be a rather cold day.
How wet? I can't give you a confident answer at this point. But it does look wetter than anything we've seen since early April. Here's a couple of individual computer forecasts from the US and Europeans.
.png)

You can see a lot of blue shading in northeast Washington on both models, which is 0.50" of precipitation. But there are a lot of models (as we've noted in the past), and a lot of them are much drier than these two examples.
The National Blend of Models (NBM) tries to come up with a blended forecast of the over 100 models, applying some bias correction. Here's what it has for a forecast.
.png)
This is obviously a much more conservative forecast, with a lot less blue shading in our area. But even this conservative forecast would give most folks in northeast Washington about 0.25" of rain.
I'll show you a new graphic that I haven't used before. The U.S. has 30 different computer forecasts in its ensemble. One way to look at all 30 of them is to pick a specific location (like Spokane) for a specific weather element (such as accumulated rainfall). You then plot the result on a graph with time going from left to right. We call these "plume diagrams".
In the plot below, each of the thin grey lines is a different computer forecast. By Saturday afternoon, a few computer forecasts have just under 0.20" for Spokane. The wettest forecast has just over 0.80" of rain. But the consensus cluster of forecasts is around 0.40". So every model gives rain to Spokane, but there's a wide range of just how much. This is not unusual, especially as the weather gets more showery in the spring and summer.

And we could use the moisture. The past 30 days have been on the drier side for most of northeast Washington. Pend Oreille county has had less than 50% of it's normal rainfall in the past 30 days.
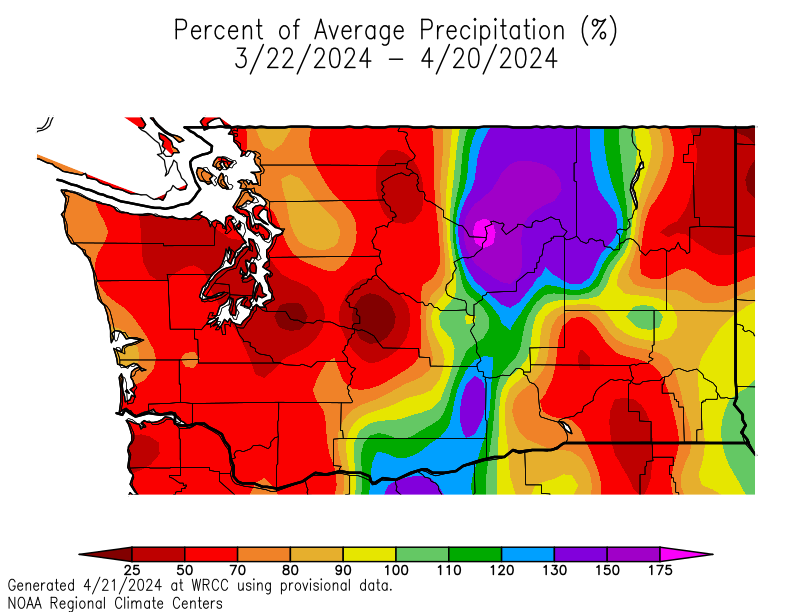
Specifically at Deer Park airport, the precipitation deficit is starting to pile up. The brown line in the graph below is what we normally would have for precipitation accumulated since 1 October. The green line is what we've had this winter/spring. The right side of the graph is the current time, and it shows a little over a 3" deficit in precipitation.
.png)
.png)


Comments
Post a Comment